Key takeaways
- Total export value under HS 190590 grew 53.0% between 2019 and 2023, expanding from 197.63 million USD to 302.31 million USD.
- Export unit values shifted from 3.26 USD per kg (3,260 USD per tonne) in 2019 to 4.02 USD per kg (4,020 USD per tonne) in 2023, representing a 23.3% increase across the series.
- Japan, Australia, and Korea represent the largest individual markets queried in 2023, accounting for 33.27 million USD, 29.44 million USD, and 25.19 million USD respectively.
- US customs mirror data shows consistent expansion, rising from 15.7 million USD recorded by US customs in 2019 to 39.44 million USD recorded by US customs in 2023.
Overview of Vietnamese Savoury Snack and Cake Exports
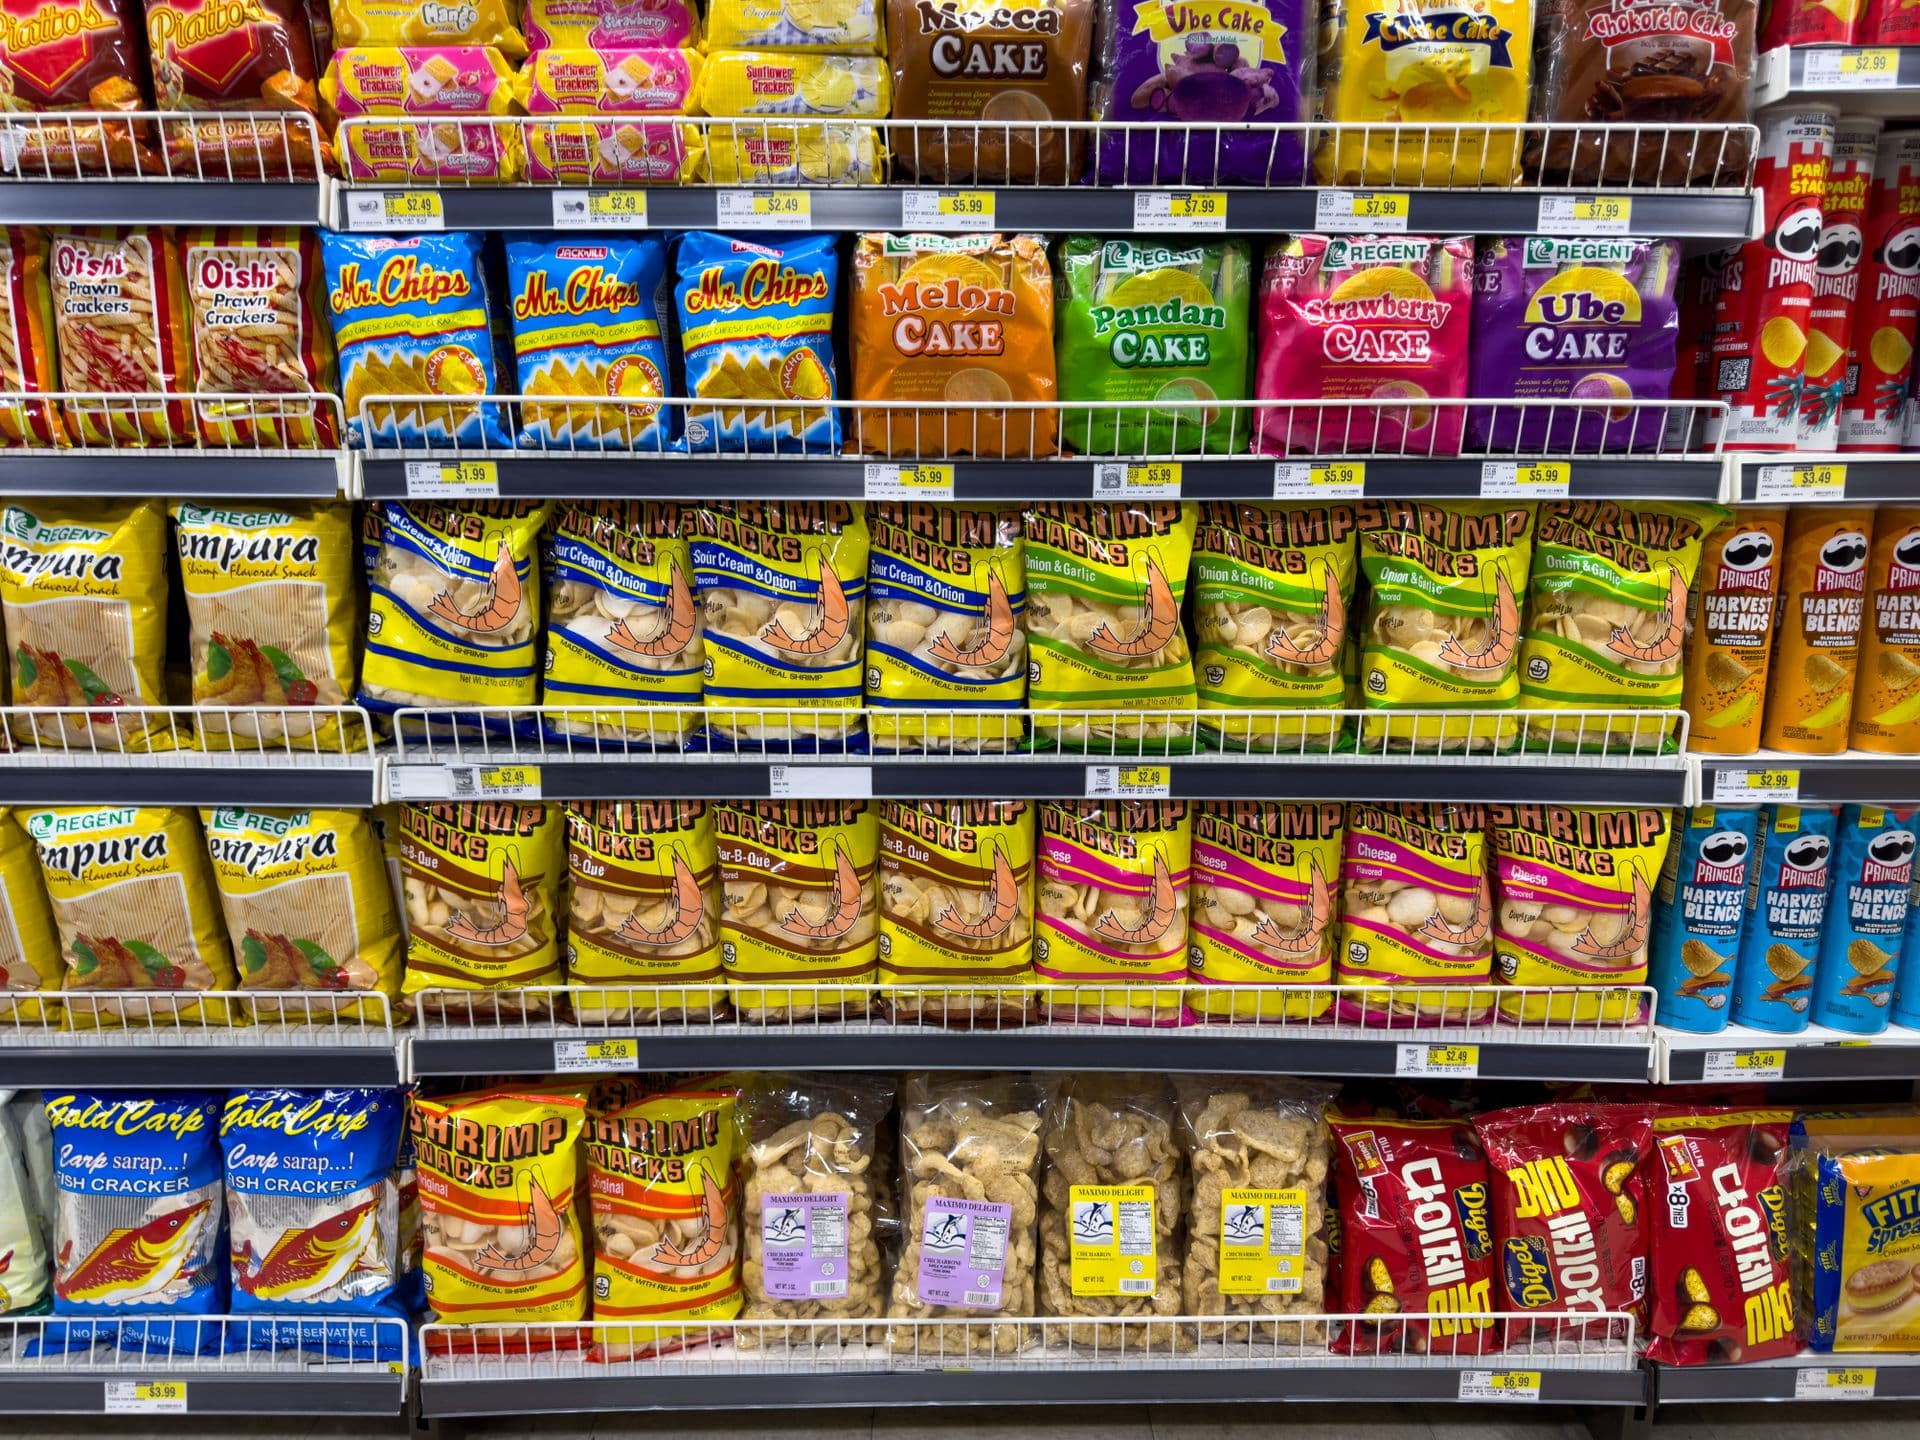
International commercial buyers evaluating processed food supply chains in Southeast Asia frequently assess Vietnam for bakery, snack, and batter-coated pastry products. When sourcing items such as a chip shop savoury cake, extruded grain bites, or traditional savoury rice crackers, procurement teams monitor export volumes and price movements under Harmonized System classification HS 190590. This customs heading includes other bakers' wares, encompassing savoury snacks, pastries, crisp savoury biscuits, and packaged cakes that sit outside narrow categories like crispbread or sweet biscuits.
Between 2019 and 2023, Vietnamese export performance across this heading expanded steadily in value. According to UN Comtrade statistics reported by Viet Nam, total outbound shipments grew from 197.63 million USD in 2019 to 302.31 million USD in 2023. Across the series, the total value increased by 53.0%. This growth reflects both the broader production capacity of industrial bakeries in Vietnam and shifting international demand for finished food lines.
For category managers and global procurement specialists, tracking this trade record provides tangible insight into factory scale, product mix evolution, and baseline cost structures across key export destinations.
Export Volume and Value Trajectory Across the Five-Year Period
The historical record from 2019 through 2023 illustrates distinct phases in Vietnamese snack and cake trade flows. In 2019, outbound trade stood at 197.63 million USD, with a physical shipment volume of 60.59 million kg and an export unit value of 3.26 USD per kg (3,260 USD per tonne).
In 2020, total trade recorded 193.02 million USD and 59.05 million kg. This represented a value down 2.3% on 2019, while the unit value stood at 3.27 USD per kg (3,270 USD per tonne), reflecting a unit value up 0.3%. Despite operational hurdles across international freight networks during this period, overall volumes and pricing remained stable.
A rebound occurred in the subsequent trading year. In 2021, export trade rose to 231.06 million USD across 71.01 million kg. This performance represented a value up 19.7% on 2020, with a unit value of 3.25 USD per kg (3,250 USD per tonne), which was a unit value down 0.6%.
Expansion accelerated further during 2022. Export value reached 290.03 million USD on volume of 84.76 million kg. The year showed a value up 25.5% on 2021, while unit prices adjusted upward to 3.42 USD per kg (3,420 USD per tonne), marking a unit value up 5.2%.
By 2023, top-line export revenue crossed the three-hundred-million-dollar threshold, settling at 302.31 million USD. Total physical volume contracted to 75.15 million kg, while the calculated unit price climbed to 4.02 USD per kg (4,020 USD per tonne). This adjustment represented a value up 4.2% on 2022 alongside a unit value up 17.5%.
Analysis of Unit Export Values and Product Mix Dynamics
Examining unit values per kilogram reveals how the product composition within HS 190590 has shifted over time. From 2019 to 2023, the baseline unit value moved from 3.26 USD per kg (3,260 USD per tonne) to 4.02 USD per kg (4,020 USD per tonne), up 23.3% across the entire series.
During the initial three years of the period, unit prices remained within a narrow band:
* 2019: 3.26 USD per kg (3,260 USD per tonne)
* 2020: 3.27 USD per kg (3,270 USD per tonne)
* 2021: 3.25 USD per kg (3,250 USD per tonne)
The shift began in 2022 at 3.42 USD per kg (3,420 USD per tonne) and culminated in 2023 at 4.02 USD per kg (4,020 USD per tonne). Several structural factors explain this movement for commercial buyers:
First, raw ingredient costs across vegetable oils, wheat flour, starches, and packaging films rose globally during 2022 and 2023. Vietnamese processors incorporated these input adjustments into their FOB pricing structures.
Second, the product mix moved toward higher-value finished items. While basic starch pellets and bulk crackers carry lower price realisations, value-added retail items such as filled snack cakes, individually wrapped pastries, and coated savoury lines yield higher export prices per kilogram. The jump in unit value in 2023, occurring even as total volume adjusted from 84.76 million kg to 75.15 million kg, highlights this transition toward higher-value export specifications.
Geographic Distribution of Export Value Across Queried Markets
Vietnamese manufacturers export bakery and savoury snack goods across diverse geographic regions. In 2023, trade data for queried destination markets demonstrates notable concentration across developed retail markets in the Asia-Pacific region and Europe.
Among the markets queried for 2023, the trade values and proportional shares were recorded as follows:
* Japan: 33.27 million USD, representing 11.0% of the year's total exports and 22.9% of the markets listed here.
* Australia: 29.44 million USD, representing 9.7% of the year's total exports and 20.2% of the markets listed here.
* Korea: 25.19 million USD, representing 8.3% of the year's total exports and 17.3% of the markets listed here.
* United Kingdom: 20.27 million USD, representing 6.7% of the year's total exports and 13.9% of the markets listed here.
* Thailand: 14.42 million USD, representing 4.8% of the year's total exports and 9.9% of the markets listed here.
* Cambodia: 9.05 million USD, representing 3.0% of the year's total exports and 6.2% of the markets listed here.
* Singapore: 5.42 million USD, representing 1.8% of the year's total exports and 3.7% of the markets listed here.
* Philippines: 4.47 million USD, representing 1.5% of the year's total exports and 3.1% of the markets listed here.
* Malaysia: 4.05 million USD, representing 1.3% of the year's total exports and 2.8% of the markets listed here.
These queried destinations illustrate that high-income retail markets maintain substantial demand for Vietnamese bakery output. Japan, Australia, and Korea combined absorbed over 87 million USD in 2023, demonstrating that Vietnamese production facilities consistently meet stringent food safety, labelling, and quality audit standards required by major supermarket chains in East Asia and Oceania.
At the same time, regional trade within Southeast Asia remains an established outlet. Thailand, Cambodia, Singapore, the Philippines, and Malaysia accounted for significant volume, supported by regional supply chains and proximity.
Comparison Between Reported Exports and US Customs Mirror Data
When evaluating export volumes, professional buyers must compare reporter data against customs mirror records. Data collected by US customs authorities (US Census Bureau) tracking receipts of goods under HS 190590 originating from Viet Nam reveals substantial trade growth that complements Vietnamese export records.
The mirror statistics recorded by US customs over the period are as follows:
* 2019: 15.7 million USD recorded by US customs, representing 7.9% of what Viet Nam reported exporting to all markets.
* 2020: 19.77 million USD recorded by US customs, representing 10.2% of what Viet Nam reported exporting to all markets.
* 2021: 28.01 million USD recorded by US customs, representing 12.1% of what Viet Nam reported exporting to all markets.
* 2022: 38.38 million USD recorded by US customs, representing 13.2% of what Viet Nam reported exporting to all markets.
* 2023: 39.44 million USD recorded by US customs, representing 13.0% of what Viet Nam reported exporting to all markets.
Discrepancies between Vietnamese export filings and US import records are standard in international trade analytics. US customs records import transactions on a CIF or customs valuation basis, which incorporates international ocean freight, marine insurance, and port handling fees not included in Vietnamese FOB export declarations.
Additionally, shipping transit durations mean that consignments leaving Vietnamese ports in late November or December are documented in the subsequent calendar year upon arrival in North American ports. Transhipment through third-party logistics hubs can also alter initial customs documentation. Nevertheless, the trajectory confirms steady US demand, with US customs receipts expanding from 15.7 million USD recorded by US customs in 2019 to 39.44 million USD recorded by US customs in 2023.
Practical Implications for Commercial Procurement and Sourcing Strategy
The trade figures provide concrete parameters for retail category buyers and industrial distributors sourcing snack and cake lines from Vietnam.
Budgeting and Pricing Benchmarks
The shift in export unit value to 4.02 USD per kg (4,020 USD per tonne) in 2023 provides an industry-wide reference point for contract negotiations. Buyers assessing private-label quotes for savoury cakes, filled pastries, or snack crackers should evaluate manufacturer proposals against this baseline. Significant variations below this level may indicate bulk packaging or basic starch recipes, while higher quotes should correspond to complex packaging, specialized ingredients, or specific regulatory certifications.
Quality Assurance and Compliance Standards
The presence of high-value shipments to Japan (33.27 million USD), Australia (29.44 million USD), Korea (25.19 million USD), and the United Kingdom (20.27 million USD) demonstrates that leading Vietnamese exporters operate under advanced processing standards. Factories supplying these destinations routinely comply with international schemes such as BRCGS, IFS, and HACCP, facilitating vendor qualification for new international buyers.
Capacity Allocation and Lead Times
With total annual volume reaching 75.15 million kg in 2023 and having peaked at 84.76 million kg in 2022, Vietnamese manufacturing infrastructure possesses large-scale production capabilities. However, buyers planning seasonal product launches or retail promotional campaigns must account for strong demand from established regional markets, requiring early capacity booking.
Trade Data Limitations and Operational Considerations
While customs figures offer an objective macroeconomic view, procurement specialists should recognize the boundaries of aggregate HS data.
First, HS heading 190590 is a broad basket category. It consolidates diverse finished goods, ranging from dry savoury rice crackers and extruded snack pellets to soft filled cakes and frozen savoury pastry sheets. Consequently, the calculated average unit value of 4.02 USD per kg (4,020 USD per tonne) represents an aggregate across multiple product tiers rather than an exact quote for a single item.
Second, customs records do not differentiate between original equipment manufacturer (OEM) contract packaging for global brands and independent brand distribution by domestic Vietnamese manufacturers. Buyers conducting supplier due diligence must verify whether prospective factories operate primarily as private-label co-packers or brand owners.
Third, the data does not capture variations in minimum order quantities (MOQs), payment terms, or lead-time reliability. These operational elements must be evaluated directly through factory audits, sample evaluations, and formal commercial tenders.
Understanding these trade flows provides commercial buyers with the data foundation required to negotiate contracts, benchmark costs, and establish resilient sourcing partnerships in Vietnam's snack and bakery manufacturing sector.
FAQ
What product categories are included under HS heading 190590 in Vietnamese trade data?
HS 190590 captures other bakers' wares, including savoury biscuits, extruded snacks, rice crackers, pastries, packaged cakes, and speciality items like chip shop savoury cake formats, excluding crispbread, gingerbread, sweet biscuits, waffles, and communion wafers.
How did Vietnamese savoury snack export pricing develop between 2019 and 2023?
Unit export values remained stable near 3.26 USD per kg (3,260 USD per tonne) in 2019 and 3.25 USD per kg (3,250 USD per tonne) in 2021, before rising to 3.42 USD per kg (3,420 USD per tonne) in 2022 and reaching 4.02 USD per kg (4,020 USD per tonne) in 2023.
Which destination markets absorb the highest share of Vietnamese bakery and snack exports?
Among queried markets in 2023, Japan led with 33.27 million USD, followed by Australia at 29.44 million USD, Korea at 25.19 million USD, and the United Kingdom at 20.27 million USD.
Why do US import figures differ from Vietnam export figures under HS 190590?
Differences between reported export values and US customs mirror records stem from valuation methods, freight and insurance additions (FOB versus CIF), shipping transit intervals, and intermediate transhipment hubs.
Read next
Related: our product range