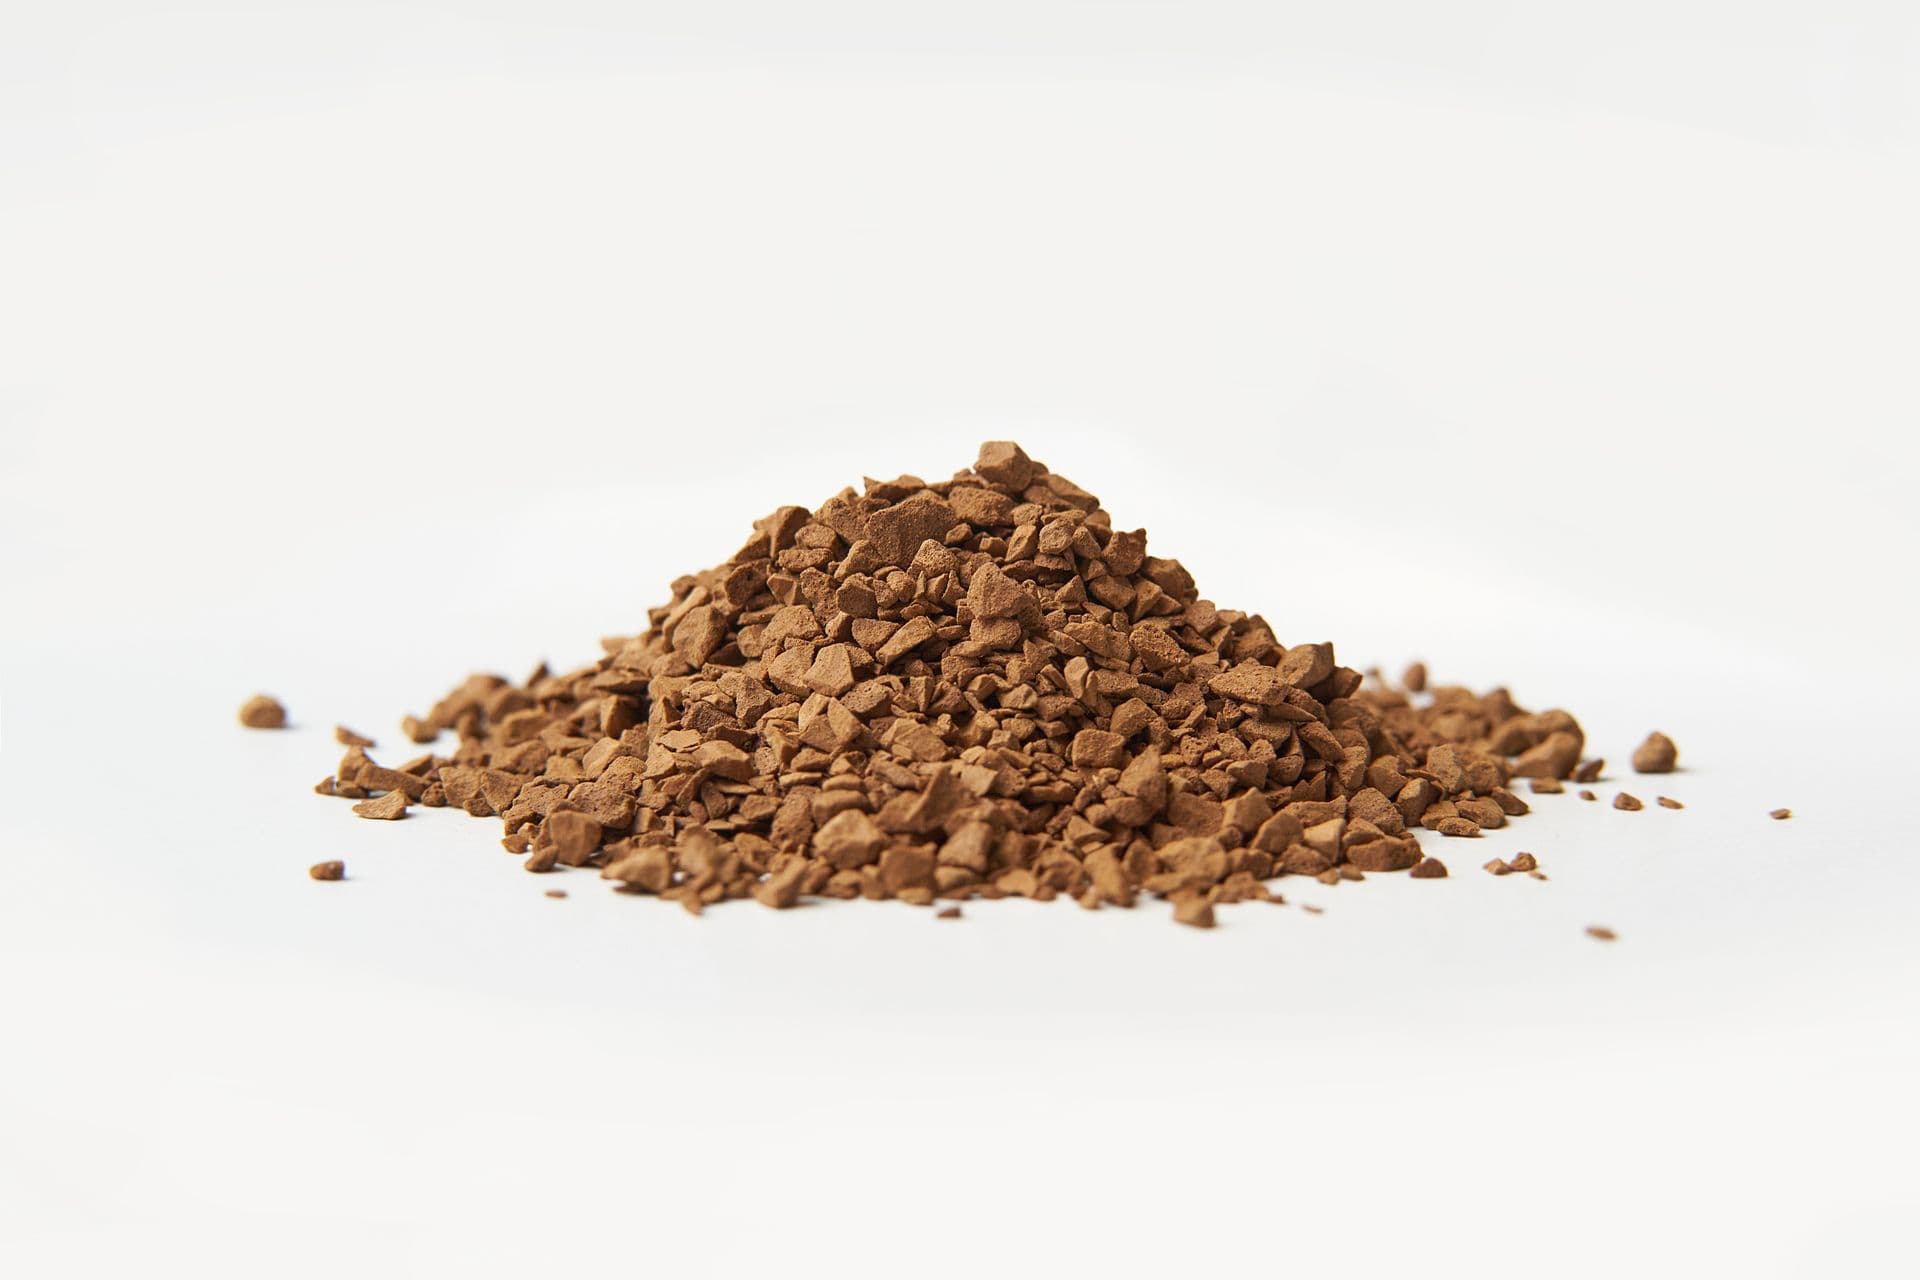
עיקרי הדברים
- Total export value under HS 210111 rose by 35.6% from 2019 to 2023, reaching 507.51 million USD despite declining physical volume.
- Export unit value experienced a steep increase of 130.4% across the series, shifting from 3.85 USD per kg in 2019 to 8.87 USD per kg in 2023.
- Regional Asian markets account for the largest share of queried destinations, led by the Philippines (71.89 million USD) and Japan (55 million USD) in 2023.
- US customs mirror data reveals import peaks in 2022 followed by a contraction in 2023, highlighting the necessity of verifying bilateral clearance records.
Executive Summary of Vietnamese Instant Coffee Extract Trade
Global procurement teams tracking processed beverage ingredients have observed substantial structural adjustments in Vietnamese instant coffee extract shipments over recent reporting cycles. Recorded under HS heading 210111 (extracts, essences, and concentrates of coffee), the trade flow from Viet Nam demonstrates a defined transition toward higher unit realizations. While raw green coffee bean trade remains sensitive to agricultural cycles, the industrial processing segment for soluble coffee and concentrated extracts reflects distinct commercial dynamics driven by processing capacity, energy inputs, and shifting destination market demands.
According to UN Comtrade statistics, total export value under this heading reached 507.51 million USD in 2023, up from 374.16 million USD in 2019. This represents an overall value growth of 35.6% across the five-year period. However, this growth in value was accompanied by a clear reduction in physical volumes exported. Volume moved downward from 97.28 million kg in 2019 to 57.22 million kg in 2023. As a result, the average export unit value climbed from 3.85 USD per kg (3,850 USD per tonne) in 2019 to 8.87 USD per kg (8,870 USD per tonne) in 2023, marking a cumulative unit value increase of 130.4%.
For international buyers, these metrics signal a changing procurement environment in Viet Nam. Sourcing instant coffee extract requires understanding how rising baseline costs, evolving product specifications (such as agglomerated versus freeze-dried formulations), and regional supply chains impact contract negotiations and inventory strategies.
Annual Export Value and Volume Trajectories (2019-2023)
A detailed review of the annual figures reported by Viet Nam illustrates how the trade balance shifted between volume throughput and gross export earnings across individual years:
* 2019: Total export value stood at 374.16 million USD across an export volume of 97.28 million kg, resulting in an average unit value of 3.85 USD per kg (3,850 USD per tonne).
* 2020: Value expanded to 388.19 million USD on a volume of 92.82 million kg. This represented a value up 3.8% on 2019, while the unit value increased to 4.18 USD per kg (4,180 USD per tonne), reflecting a unit value up 8.6%.
* 2021: Total revenue contracted slightly to 377.41 million USD, with volume dropping to 81.28 million kg. This represented a value down 2.8% on 2020, even as the unit value climbed to 4.64 USD per kg (4,640 USD per tonne), an increase of 11.0%.
* 2022: Value rebounded sharply to 426.96 million USD over a volume of 73.54 million kg. This generated a value up 13.1% on 2021, with unit value reaching 5.81 USD per kg (5,810 USD per tonne), a unit value up 25.2%.
* 2023: Gross receipts reached a series high of 507.51 million USD despite volume falling to 57.22 million kg. This marked a value up 18.9% on 2022, while unit value advanced significantly to 8.87 USD per kg (8,870 USD per tonne), representing a unit value up 52.7% over the prior year.
The volume contraction from 97.28 million kg in 2019 to 57.22 million kg in 2023, paired with the continuous increase in unit values, indicates that volume output alone is no longer the primary driver of top-line export revenue in the Vietnamese extraction sector.
Analysis of Unit Value Movements and Product Mix
The steady rise in unit value from 3.85 USD per kg (3,850 USD per tonne) in 2019 to 8.87 USD per kg (8,870 USD per tonne) in 2023 represents an overall shift of 130.4%. The annual increases were progressive throughout the period: unit value up 8.6% in 2020, unit value up 11.0% in 2021, unit value up 25.2% in 2022, and unit value up 52.7% in 2023.
Several industrial factors explain this upward pricing trajectory:
Processing Technologies and Product Grades
HS 210111 aggregates several distinct technological formats, including standard spray-dried powder, agglomerated granules, freeze-dried soluble crystals, and concentrated liquid coffee bases. Spray-dried powder represents the baseline extraction format with lower production overhead. Freeze-dried extracts require substantial refrigeration energy and capital equipment, yielding higher commercial price points per kilogram. An increase in domestic freeze-drying installations and secondary agglomeration lines across industrial zones in southern Viet Nam has shifted the overall export mix toward higher-value products.
Raw Material and Energy Inputs
The extraction process requires substantial green coffee inputs, thermal energy for steam production, and electrical power for drying and solvent handling. Increases in Robusta bean benchmark prices, coupled with changes in industrial utility tariffs, packaging materials, and transport logistics, placed upward pressure on base production costs across 2022 and 2023. Processors adjusted export quotations to maintain margin structures across contracted batches.
Major Destination Markets in 2023
Vietnamese instant coffee extract exports serve a diverse set of international buyers, with significant volume directed into Asia-Pacific regional supply chains. In 2023, export distribution across the queried destination markets showed specific geographic concentration.
The Philippines
The Philippines ranked as the largest queried market in 2023, recording 71.89 million USD. This accounted for 14.2% of the year's total exports and represented 31.4% of the markets listed here. The Philippine market utilizes Vietnamese soluble extract heavily in ready-to-drink beverage manufacturing, retail 3-in-1 coffee mixes, and institutional food service channels.
Japan
Japan represented the second largest queried destination, importing 55 million USD in 2023. This comprised 10.8% of the year's total exports and 24.0% of the markets listed here. Japanese procurement is characterized by stringent quality assurance thresholds, specific sensory profiles, and strict compliance regarding chemical residues and extraction yields.
Other Queried Regional and Global Destinations
The remaining queried markets in 2023 demonstrated varying levels of demand across retail, industrial, and re-export sectors:
* Thailand: 34.46 million USD, representing 6.8% of the year's total exports and 15.1% of the markets listed here.
* Malaysia: 28.6 million USD, accounting for 5.6% of the year's total exports and 12.5% of the markets listed here.
* Korea: 19.05 million USD, taking 3.8% of the year's total exports and 8.3% of the markets listed here.
* Australia: 8.84 million USD, representing 1.7% of the year's total exports and 3.9% of the markets listed here.
* United Kingdom: 8.08 million USD, making up 1.6% of the year's total exports and 3.5% of the markets listed here.
* Singapore: 2.5 million USD, accounting for 0.5% of the year's total exports and 1.1% of the markets listed here.
* Cambodia: 414,593 USD, representing 0.1% of the year's total exports and 0.2% of the markets listed here.
These queried figures represent a selected group of destination countries rather than an exhaustive global accounting. Nevertheless, they highlight the substantial commercial role played by neighboring ASEAN economies and North Asian industrial processors in consuming Vietnamese extract capacity.
United States Customs Mirror Data Discrepancies
Evaluating bilateral trade flows requires comparing reported export data from the origin country against import records published by destination customs authorities. Records compiled by the US Census Bureau for HS 210111 illustrate how partner-country data can diverge from origin reporting:
* 2019: 4.91 million USD recorded by US customs, representing 1.3% of what Viet Nam reported exporting to all markets.
* 2020: 10.44 million USD recorded by US customs, representing 2.7% of what Viet Nam reported exporting to all markets.
* 2021: 14.75 million USD recorded by US customs, representing 3.9% of what Viet Nam reported exporting to all markets.
* 2022: 16.57 million USD recorded by US customs, representing 3.9% of what Viet Nam reported exporting to all markets.
* 2023: 10.39 million USD recorded by US customs, representing 2.0% of what Viet Nam reported exporting to all markets.
These variances stem from standard international trade reporting factors. First, export declarations in Viet Nam are typically recorded on a Free on Board (FOB) basis, whereas US customs records imports on a Cost, Insurance, and Freight (CIF) or Customs Value basis. Second, transhipment via regional trading hubs such as Singapore or European logistics gateways can result in cargo being recorded under intermediary trade jurisdictions before arriving in North America. Third, timing differences between departure dates at Vietnamese ports (such as Cat Lai or Hai Phong) and customs clearance dates at US points of entry frequently push year-end container volumes into the following fiscal calendar.
Strategic Implications for Commercial Buyers
Procurement managers sourcing instant coffee extract from Viet Nam must adjust commercial terms and contract structures to align with market realities:
Forward Costing and Price Linkage
Given that unit values increased from 3.85 USD per kg (3,850 USD per tonne) in 2019 to 8.87 USD per kg (8,870 USD per tonne) in 2023, fixed-price long-term supply agreements have become harder for processors to maintain without indexation clauses. Buyers should evaluate pricing models that separate baseline green bean input costs from conversion margins, spray-drying overhead, and packaging materials. This approach offers cost transparency and protects supply commitments during volatile market phases.
Volume Commitment and Factory Lead Times
As national export volume decreased from 97.28 million kg in 2019 to 57.22 million kg in 2023, processing plants have placed greater emphasis on scheduled production campaigns rather than speculative inventory holding. To secure line time, international buyers must establish forward demand forecasts with lead times that accommodate extraction schedules, quality control testing, and container booking windows.
Specification Standards and Documentation
Exporting instant coffee extract to diverse regulatory regimes requires rigorous compliance oversight. Shipments destined for markets like Japan (55 million USD in 2023) or the United Kingdom (8.08 million USD in 2023) require compliance with distinct pesticide maximum residue limits (MRLs), moisture parameters, and solubility standards. Buyers must define batch testing protocols before release to prevent port-of-entry rejections or reprocessing costs.
Limitations of Customs Trade Statistics
While UN Comtrade and national customs records provide reliable macro-level trade tracking, buyers should understand the limitations inherent in customs-level trade data:
Sub-Heading Granularity
HS 210111 covers all extracts, essences, and concentrates of coffee under a single six-digit code. The data does not differentiate between standard spray-dried coffee powder, high-value freeze-dried granules, decaffeinated formulations, or liquid extracts shipped in bulk intermediate bulk containers (IBCs). Consequently, changes in aggregate unit value can reflect either absolute factory price inflation or a structural change in the underlying product mix.
Private Label and Intercompany Transfers
Customs data aggregates all commercial transactions, combining direct sales to brand owners, contract manufacturing for retail private labels, and internal transfers between multinational processing affiliates. It does not provide insight into commercial payment terms, distributor margins, or specific brand market shares within destination territories.
Sourcing Recommendations and Operational Outlook
Navigating the Vietnamese instant coffee extract market requires an operational approach grounded in objective data. As export receipts reached 507.51 million USD in 2023 and unit values reached 8.87 USD per kg (8,870 USD per tonne), sourcing professionals must move beyond simple transactional purchasing.
Key procurement priorities should include:
1. Factory Audits and Technical Validation: Verify that extraction lines have adequate capacity, solvent recovery systems, and drying controls to match target sensory specifications.
2. Tiered Supplier Portfolios: Balance contracts across primary industrial processors capable of handling high-volume standard spray-dried runs and specialized facilities catering to freeze-dried or customized flavor profiles.
3. Cross-Border Logistics Management: Account for freight variability and transhipment timelines, ensuring shipment records and certificates of origin are aligned to satisfy destination customs standards without administrative delays.
By understanding historical trade flows, unit value shifts, and destination market requirements, buyers can establish resilient, cost-effective supply chains for Vietnamese instant coffee extract.
שאלות נפוצות
What product category is covered under HS 210111 for instant coffee extract exports?
HS 210111 covers extracts, essences, and concentrates of coffee, including spray-dried, freeze-dried, and liquid coffee extracts used in commercial manufacturing and retail packaging.
How did Vietnamese instant coffee extract export unit values move between 2019 and 2023?
The unit value rose consistently each year, moving from 3.85 USD per kg (3,850 USD per tonne) in 2019 to 8.87 USD per kg (8,870 USD per tonne) in 2023, representing an overall increase of 130.4%.
Which destination markets absorb the largest share of Vietnamese instant coffee extract?
In 2023, the top queried destinations were the Philippines at 71.89 million USD (14.2% of total exports) and Japan at 55 million USD (10.8% of total exports), followed by Thailand, Malaysia, and Korea.
Why do US customs import records differ from reported Vietnamese export statistics?
Discrepancies between Vietnamese export data and US customs mirror records occur due to shipping lead times, freight and insurance additions, classification differences, and intermediary transhipment routes.
קראו בהמשך
קשור: מגוון המוצרים שלנו